

Before you start
- An organization API key. An Owner creates it under Settings > API keys. See Settings.
- An agent instrumented with OpenTelemetry. Arklex reads tool calls from these instrumentations:
- Google ADK
- OpenInference, for LangChain, LangGraph, and the OpenAI Agents SDK
- LangSmith OpenTelemetry export
- The OpenTelemetry GenAI semantic conventions
Set up your agent
1
Find the endpoint
Open your agent’s detail page and go to the Configuration tab. Copy the OTLP/HTTP traces endpoint from the Tool call tracing card.
2
Export traces to Arklex
Configure your agent’s OpenTelemetry exporter, or your OpenTelemetry Collector, to send traces to that endpoint. Authenticate with your API key in the The
Authorization: Bearer ark_... header.With the OpenTelemetry SDK, you can set the standard environment variables:%20 stands for the space after Bearer. Arklex accepts protobuf or JSON, optionally gzip-compressed.3
Link traces to the simulation
Each message Arklex sends carries a W3C
traceparent header. Your HTTP server must continue the trace it starts, so your tool spans are linked to the simulation. For example, use opentelemetry-instrumentation-fastapi or opentelemetry-instrumentation-flask.If your framework always starts a new trace for each request, copy the incoming baggage entry arklex.capture.id onto your spans as an attribute instead.Instrumenting only Google ADK or LangChain doesn’t read the
traceparent header, so add the HTTP server instrumentation too. Google ADK records tool spans on its own. LangChain and LangGraph need OpenInference or LangSmith OpenTelemetry export.Capture tool calls in a simulation
When you create a simulation, turn on Capture tool calls. If your agent sends traces in slow batches, raise Trace wait time (seconds) under Advanced. See Simulations for the setting’s range and default. Through the API, turn on trace capture when you create the simulation. See API overview.Read the results
On the simulation’s detail page, the Tool calls column shows each conversation’s capture status:
While traces are arriving, the header shows how many conversations are still collecting. In a transcript, click N tool calls under an agent message to see each call’s arguments, result or error, and duration. If a turn’s capture is incomplete, the transcript shows why, for example “no traces received from the agent”.
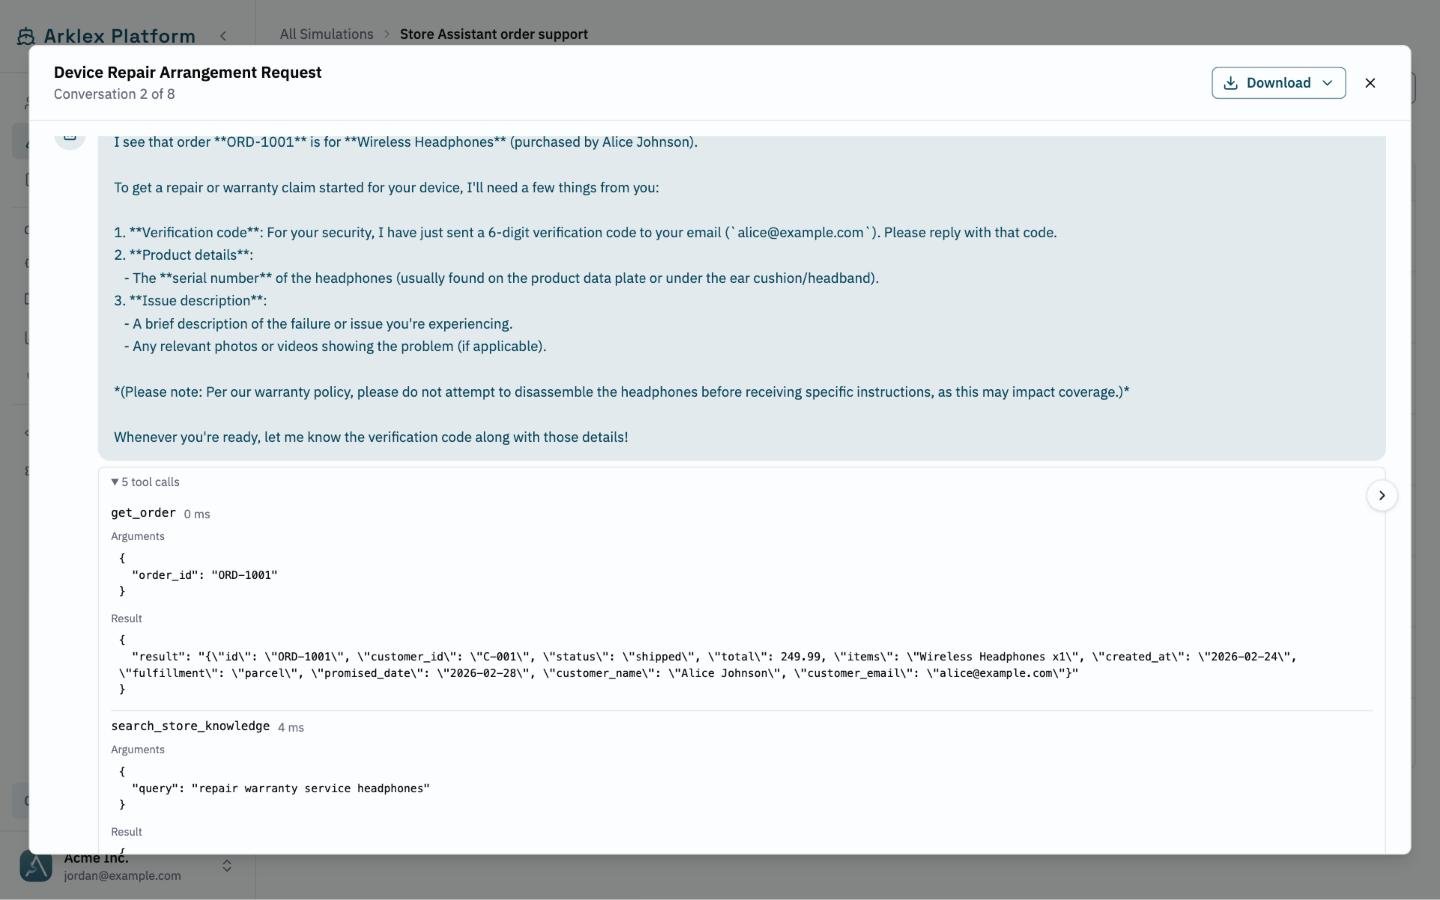
Check tool calls
- Assertions: add a Tool calls assertion to a scenario to list the tools the agent must call or must never call, in order or in any order. See Assertions.
- Metrics: select the Tool call behavior metric in an evaluation to flag incorrect tool use, such as the wrong tool, wrong parameters, unnecessary calls, ignored results, or unsafe actions. See Metrics.
Limits
- Each organization can send up to 600 requests and 64 MiB of traces per minute. Traces that don’t belong to a simulation count against a separate limit of the same size. Over the limit, Arklex returns
429with aRetry-Afterheader. - Each request can be up to 4 MiB compressed and hold up to 2,000 spans. Uncompressed, it can be up to 16 MiB for protobuf and 4 MiB for JSON.
- Each turn keeps up to 2,000 spans and 16 MiB of trace data. Spans past that are dropped, and the transcript says some were dropped.
- A tool call’s arguments and result are cut at 64 KiB each, and its error at 8 KiB.
Troubleshooting
The column shows No tool calls captured
The column shows No tool calls captured
Check that your exporter sends traces to the endpoint on the Configuration tab with a valid API key. Then check that your HTTP server continues the incoming
traceparent, or copies arklex.capture.id onto your spans.Some turns are missing tool calls
Some turns are missing tool calls
Your agent may send traces after the wait time ends. Increase Trace wait time (seconds) under Advanced and run the simulation again.
Traces from my production agent don't appear
Traces from my production agent don't appear
That’s expected. Arklex keeps only traces that belong to a simulation and discards the rest.